Information reporting made easy
Rhino Analytics is a UK based data solutions consultancy that will
empower you to make better business decisions
Confidently grow your business with us







 Connected Data wanted a technology partner to develop an entire BI platform, providing ongoing support. Here’s how we helped.

 CGL wanted more comprehensive reporting from their existing Project Information Management system. We helped to cleanse, reformat and migrate their data.

 Equias were experiencing project delays and urgently needed development for a trade reporting product. Here’s how we helped.

We equip your data champions with best-fit tools

"BI As A Service is a game changer for us. I'm happy that we are now able to consolidate information from multiple sources. Rhino Analytics have given us the ability to easily visualise complex customer data histories. With no in-house BI expertise, it's a relief to know that they are always there to provide technical support as and when we need it."

"Rhino Analytics helped us understand the benefits of implementing a strategic Project Information Management system. Capturing project documentation and emails in one central location has allowed our teams to do more in less time, keeping projects on schedule and increasing the quality of our work."

"We rely on accurate metrics for conducting market research. Rhino Analytics showed us how to enhance our data reports by automating mundane tasks and making best use of our existing BI and Project Information management tools."

"Rhino Analytics made it possible for us to get a better grip on managing business operations by cleansing data and customising our CRM system. Key decisions are far easier now that they are based on one true source of organised information."
Move away from instinct-driven to
fact-based decision making
The right business intelligence solution has the capacity to create a data-driven culture that will drive profits and satisfy customers. Rhino Analytics can show you how.
Establish a robust data management process
We'll help you build and implement a business information solution that will help reduce lengthy preparation. The result? More time to spend analysing your KPIs and other business-related metrics.
Organise, standardise and structure your data
Only an integrated business intelligence solution can provide you with a snapshot of your business in real time. Fully understand your current information and which sources need to work collaboratively. A clean up exercise will ensure your analytics software digests it effectively.
Use best-fit tools for quick access and smart analysis
Use your business intelligence solution to make your data more readable for managers, executives, and general business users. Impress them with stunning dashboard visualisations and rich, actionable analytics.
Keep your data secure
Everything you need in one place: Your business intelligence solution's dahsboard will provide you with once source of truth using industry leading encryption and real-time access monitoring capabilities.
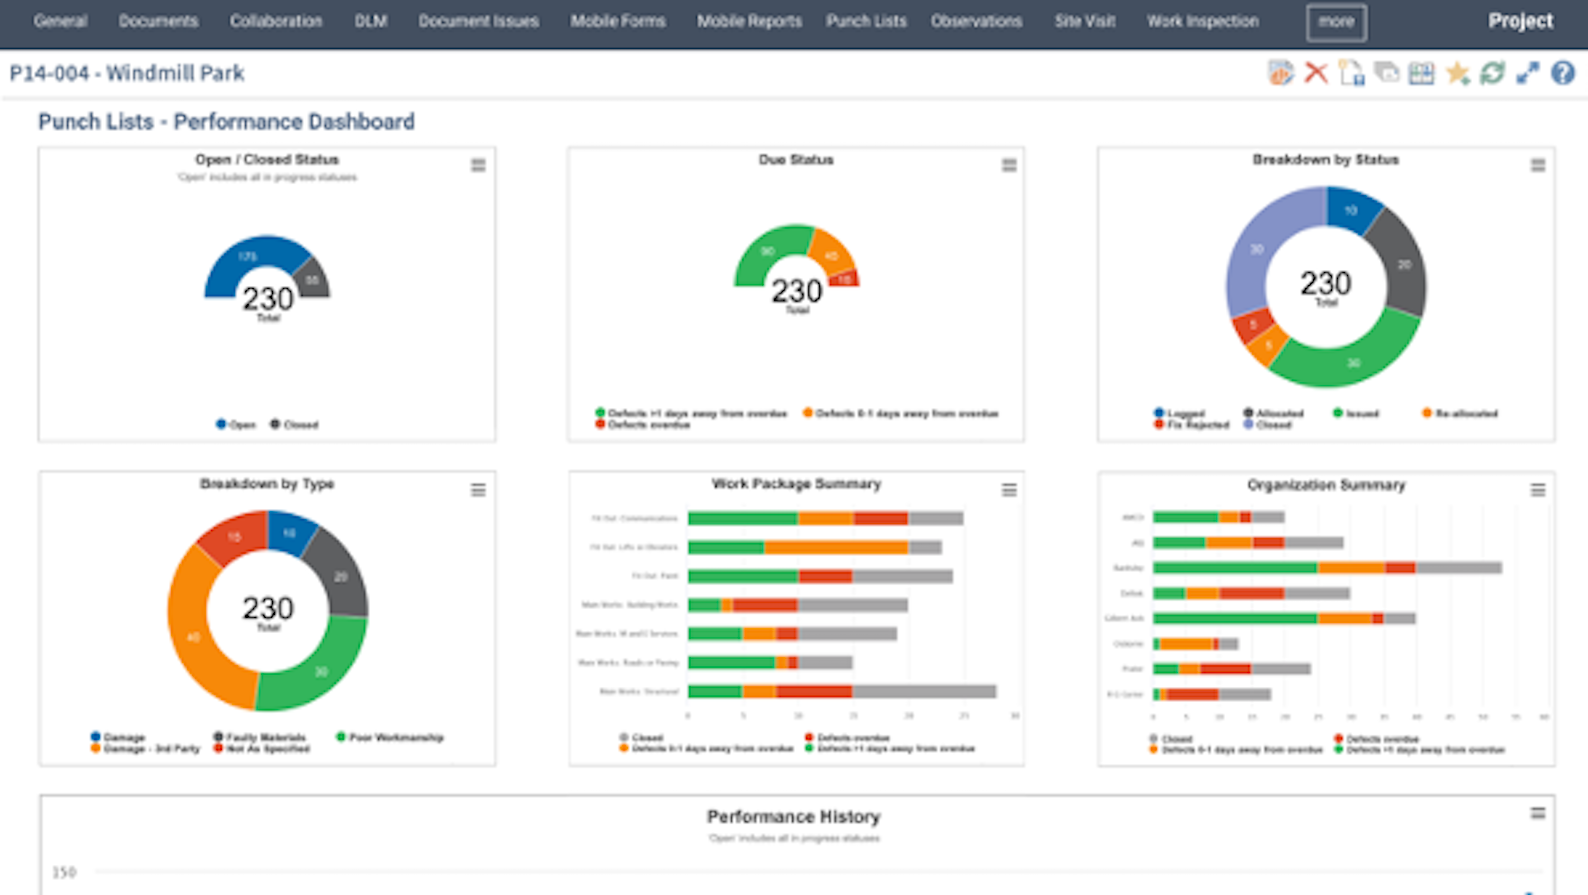
Explore innovative software
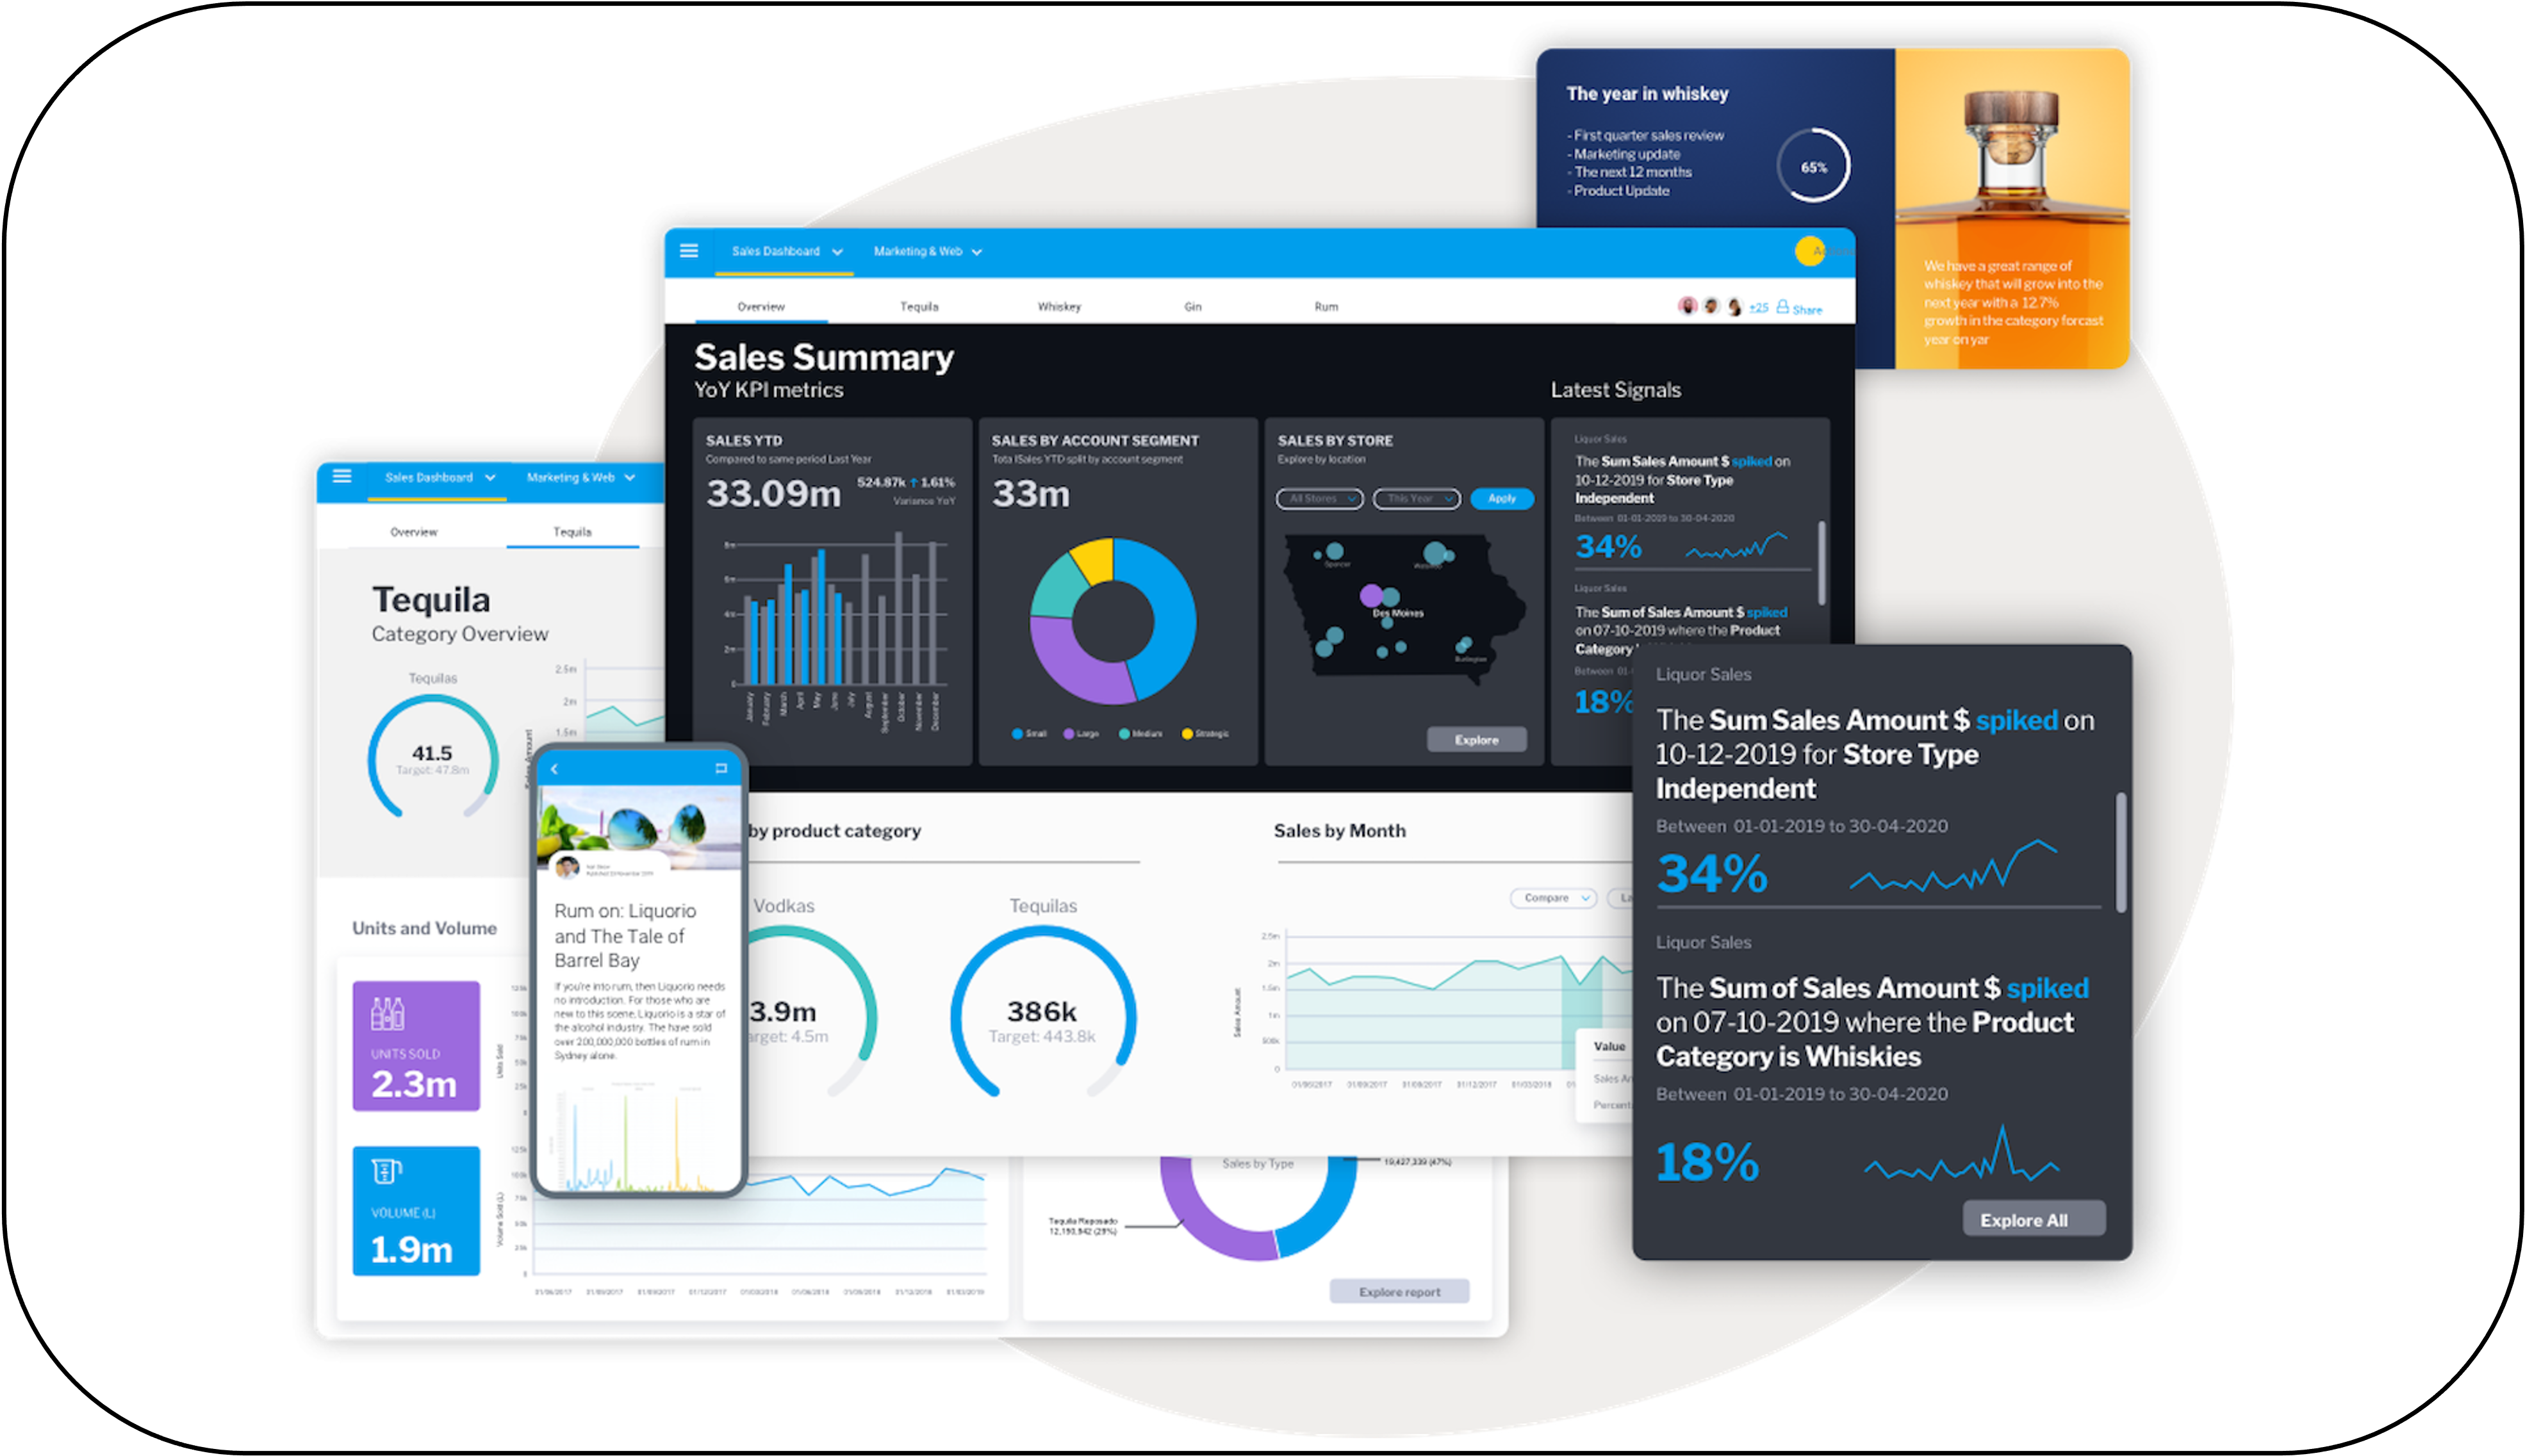
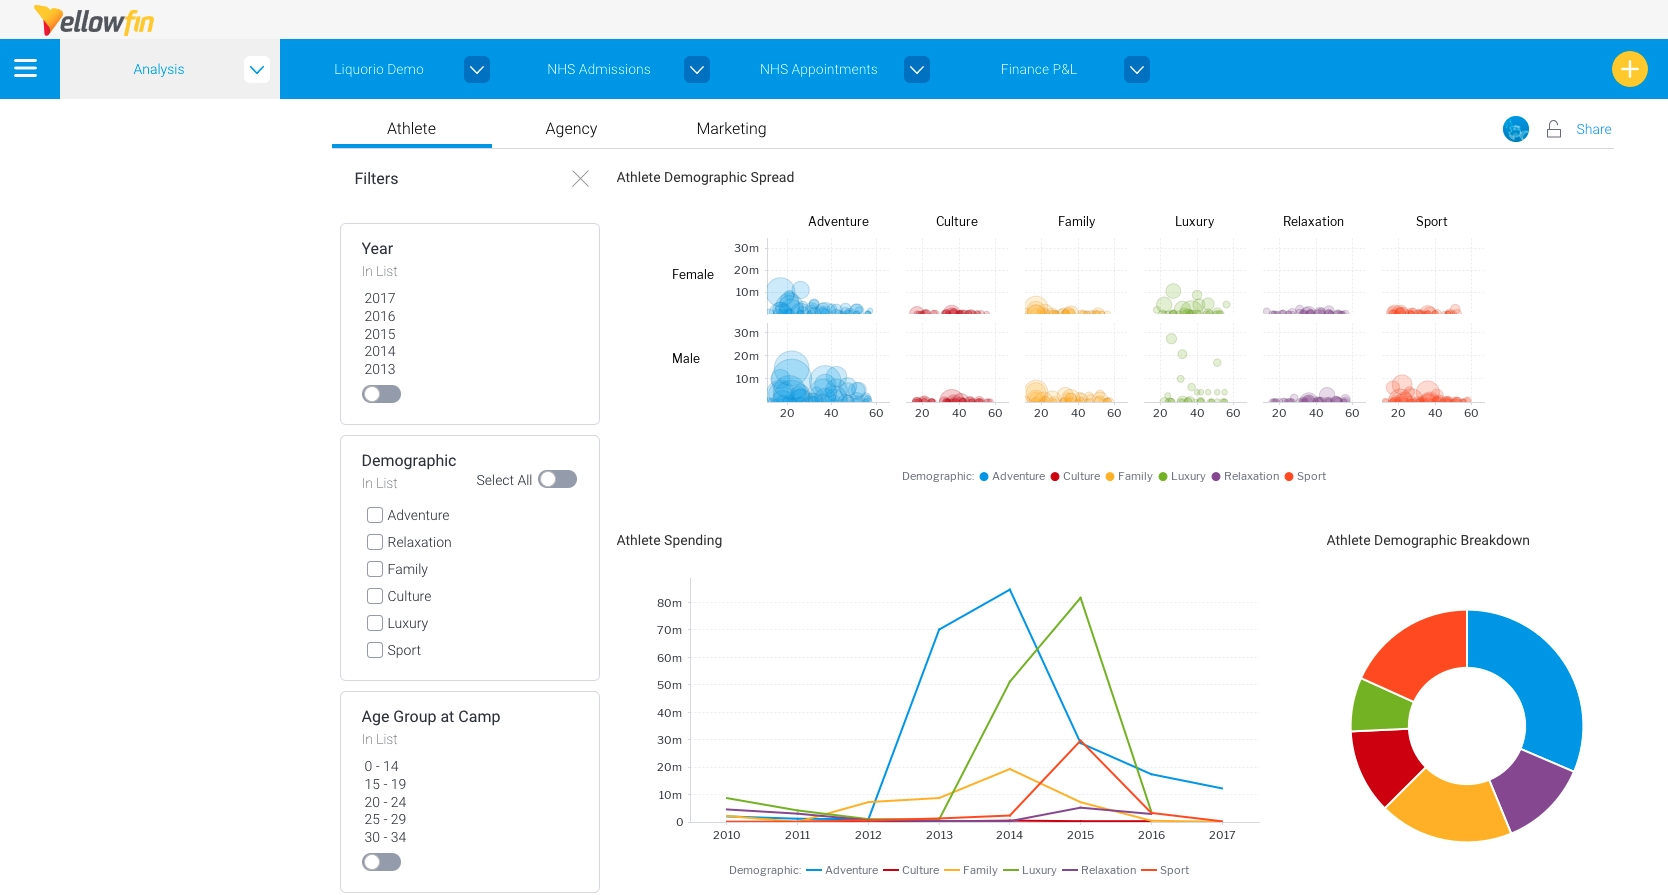
Yellowfin Business Intelligence
Analytics made simple. Build beautiful dashboards that drive action, tell compelling stories with data and monitor your business in real time automatically.
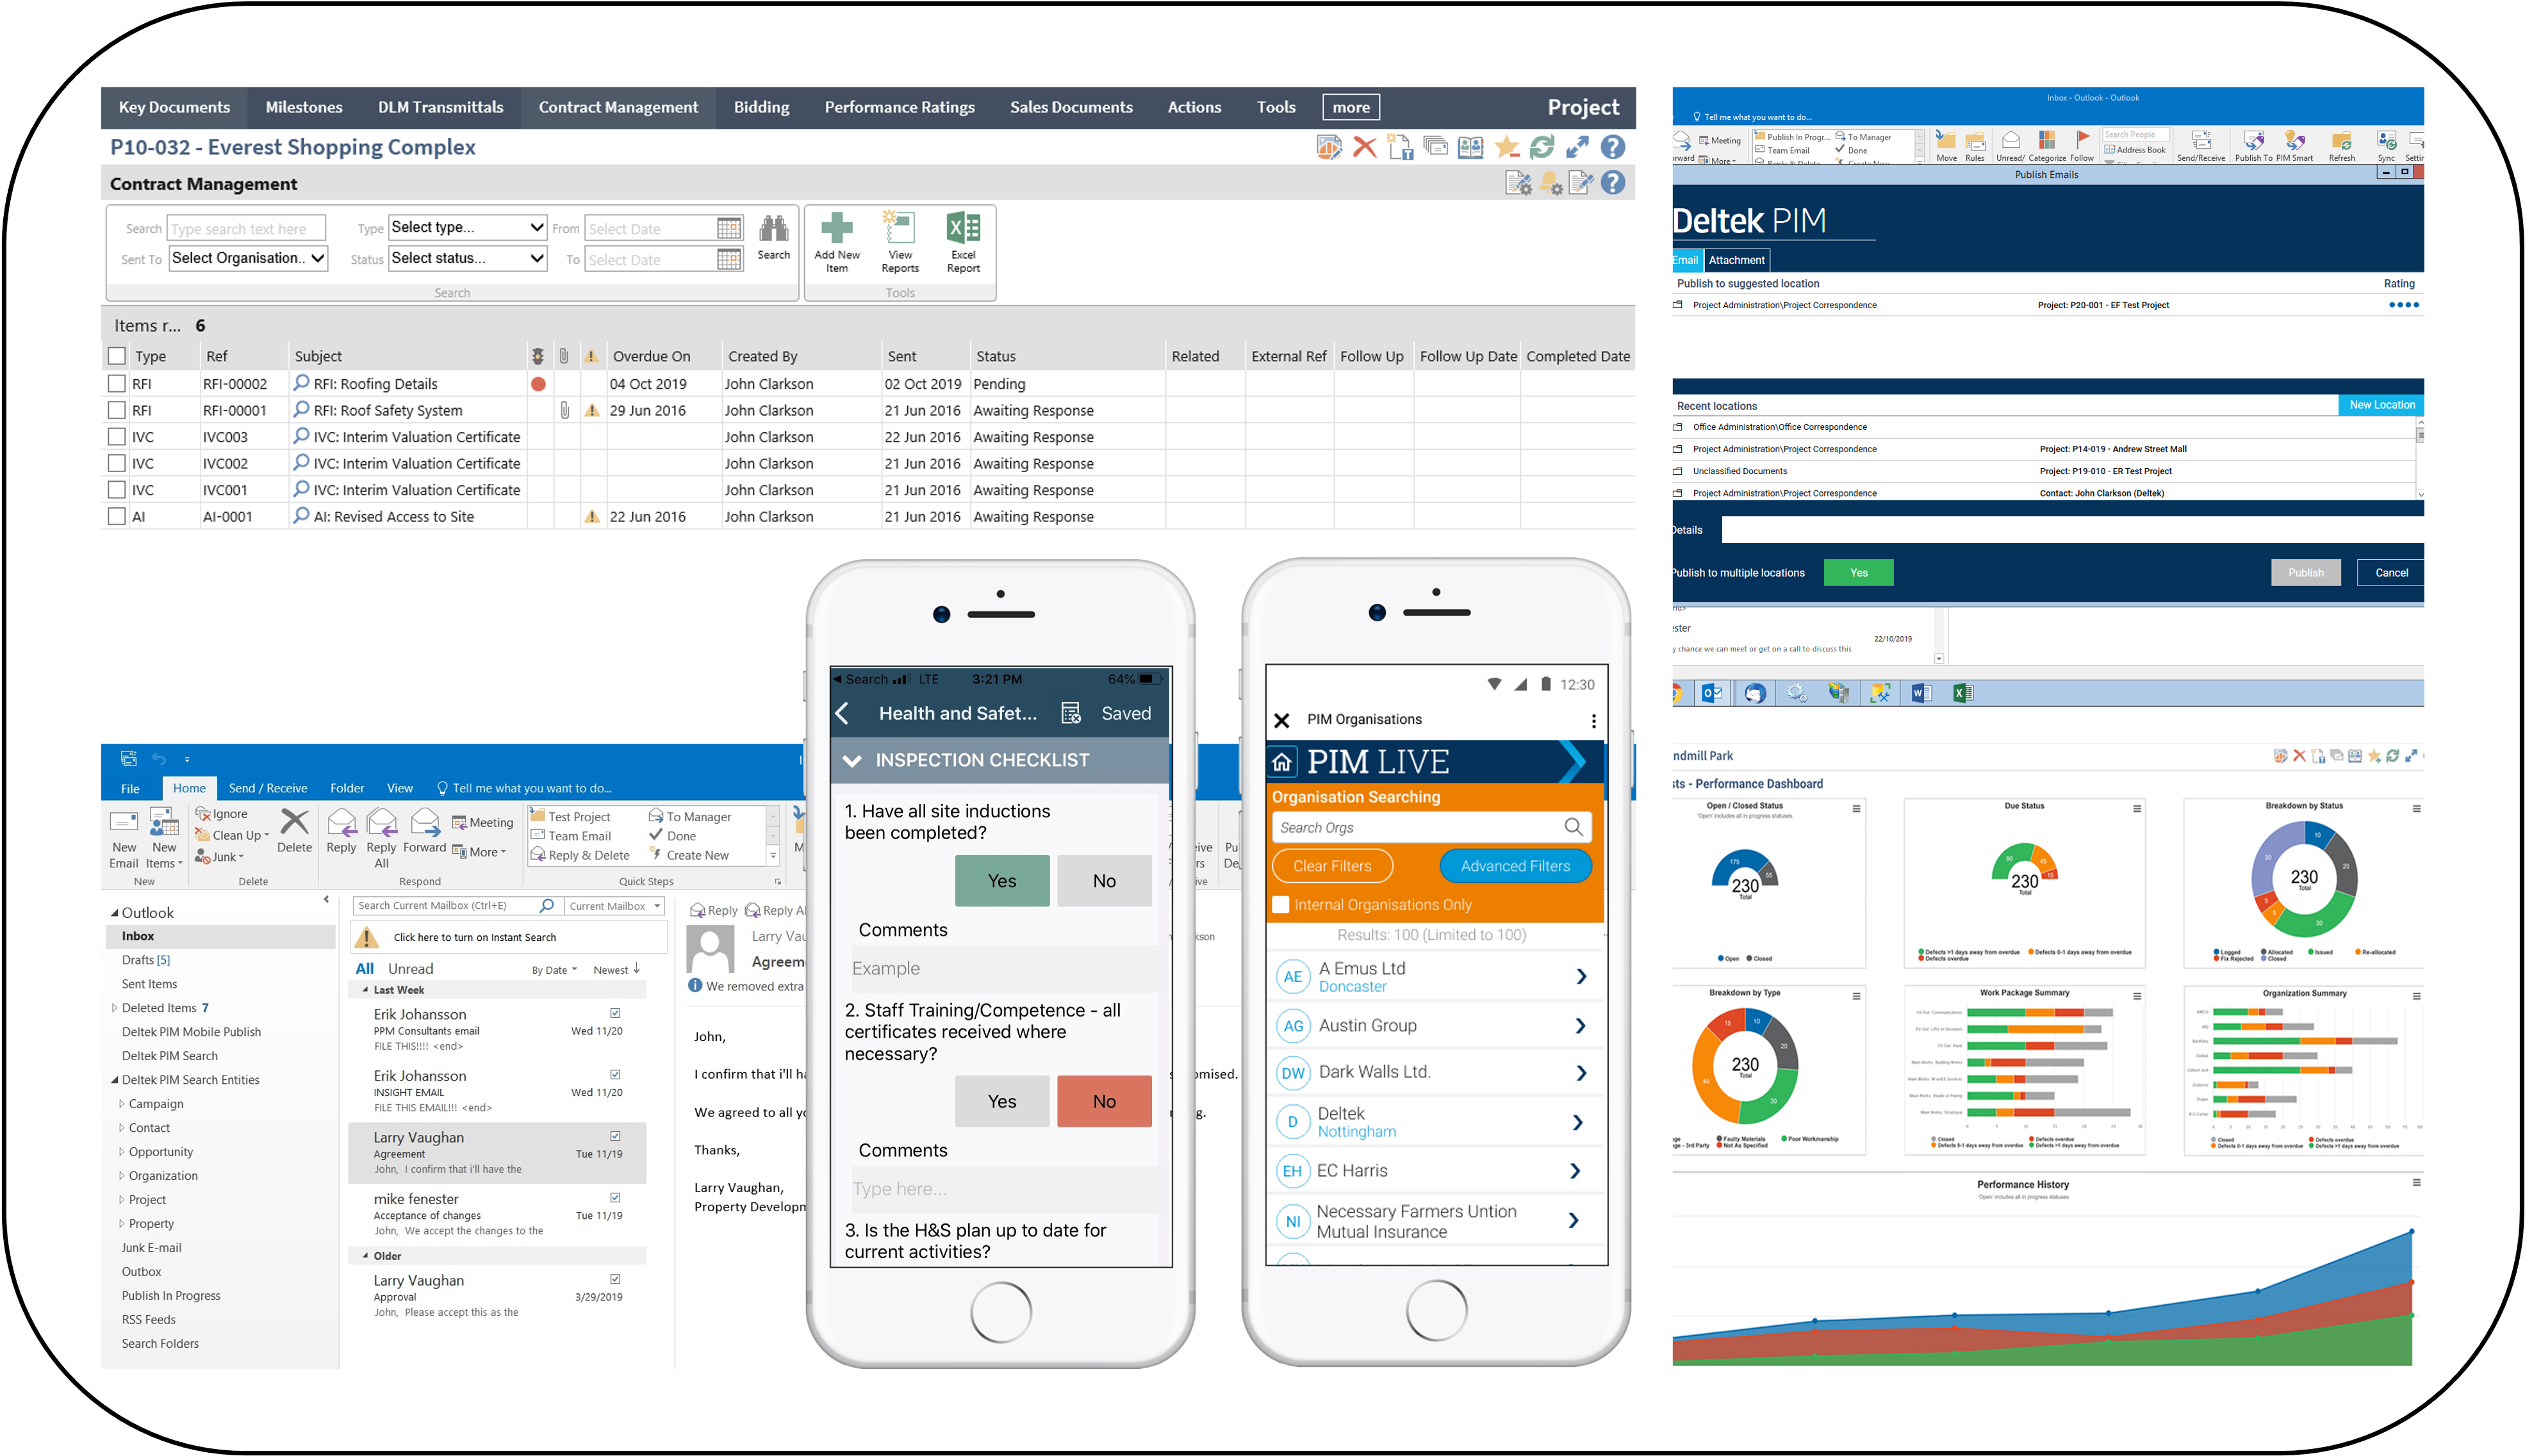
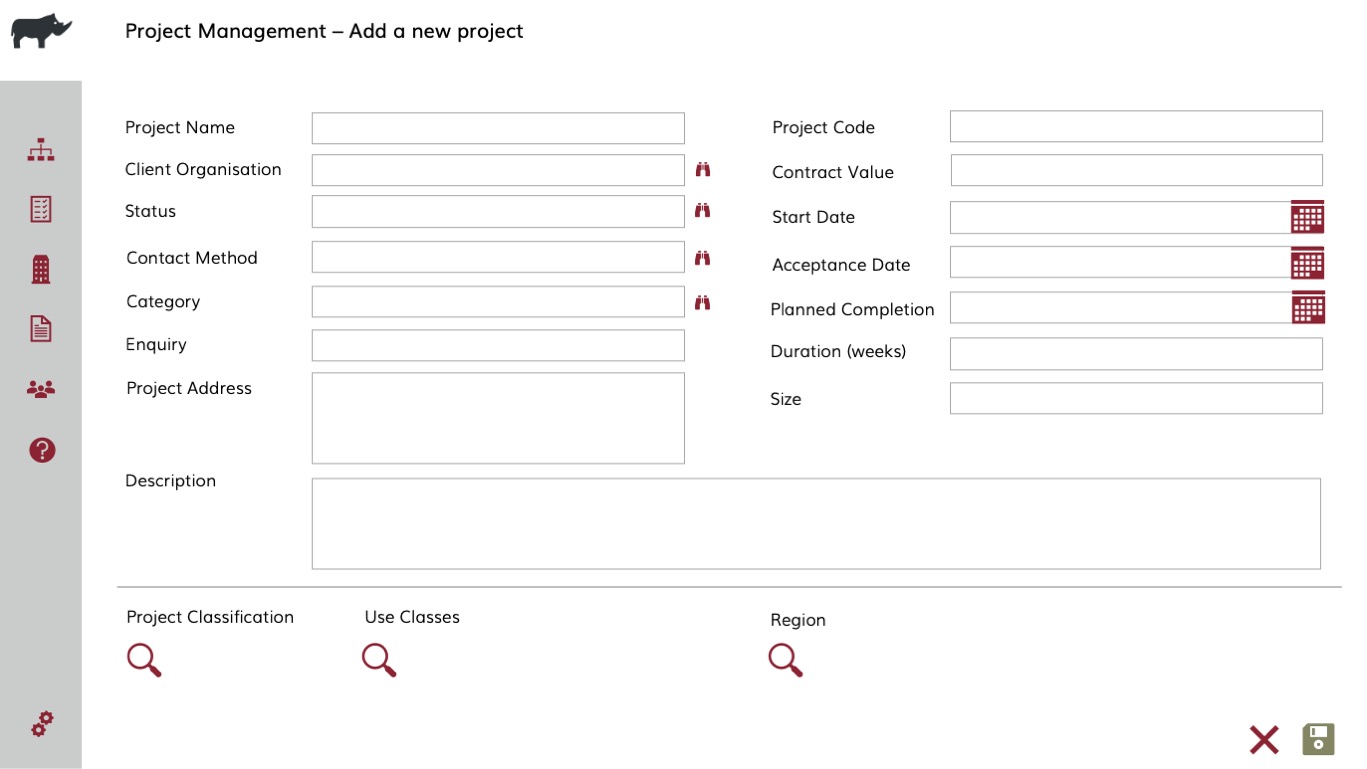
Deltek Project Information Management (PIM)
Save time with easy access to project emails, documents and drawings in one central location – reducing corporate risk and improving team collaboration.
